
RSI Confluence + MACD Scanner: A Free Tool That Screens the Entire Market for You
Every indicator we’ve covered so far watches one coin. This one is different — it watches the whole market at once. The RSI Confluence + MACD Scanner continuously screens the top USDT pairs on Binance Futures by volume, looking for coins where RSI is stretched to an extreme on three timeframes simultaneously, then runs each candidate through a strict validation filter before calling it a real setup.
If you’re tired of manually checking RSI on dozens of charts one by one, this tool does that scanning for you, automatically, every few minutes.
Why Scan the Whole Market Instead of Watching One Coin
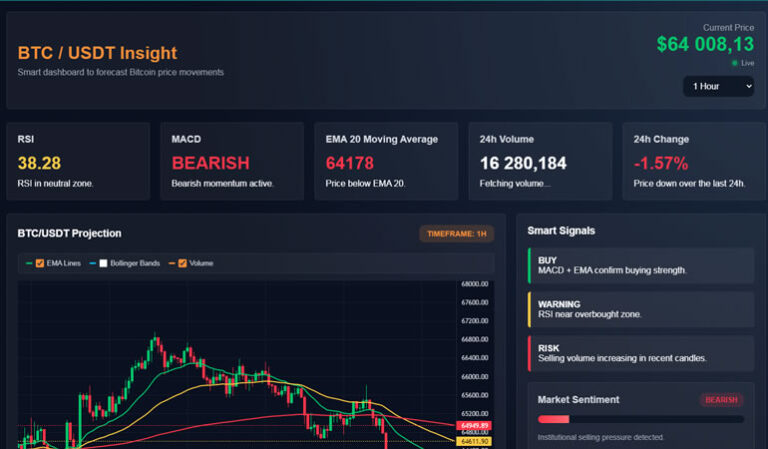
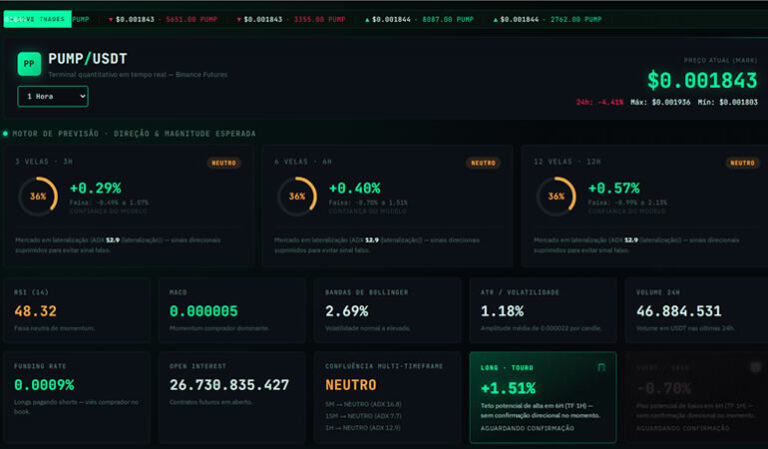
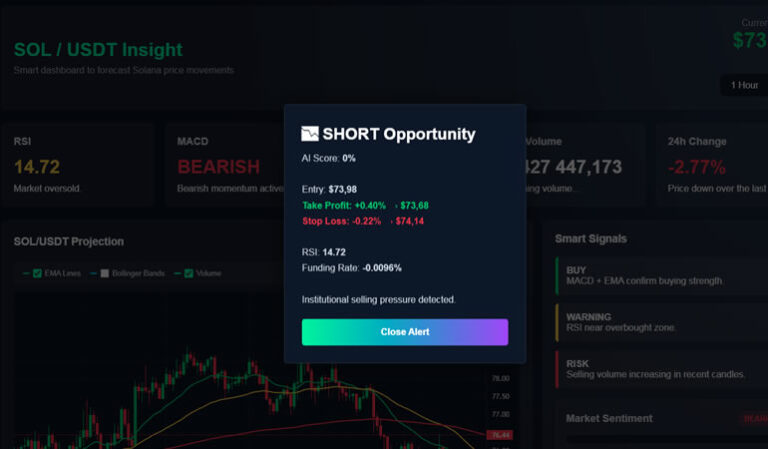
The other tools in this series — the BTC, ETH, BNB, LTC, SOL, and PUMP dashboards — are built for traders who already know which pair they want to watch and just need a faster read on it. This scanner solves a different problem: finding the setup before you know which coin it’s on. Reversal opportunities don’t appear on a fixed schedule or on your favorite pair specifically — they show up wherever RSI happens to get stretched at that moment, and by the time a manual scroll through your usual watchlist catches it, the move may already be underway. Running both together is common: use this scanner to surface a candidate, then switch to that coin’s dedicated dashboard (if it’s covered here) for a deeper, single-pair read before acting.
What Makes This a Screener, Not a Single-Chart Indicator
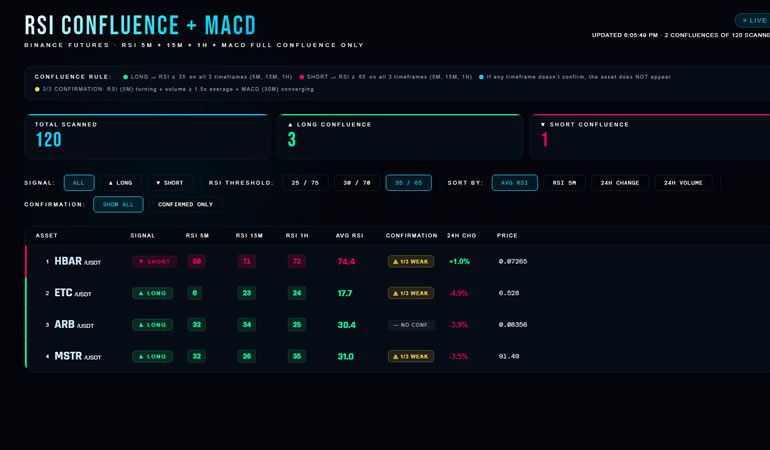
Instead of loading one trading pair, this dashboard pulls the full list of USDT perpetual futures on Binance, filters out low-liquidity coins below a minimum 24h volume threshold, and then analyzes each remaining symbol individually. It checks RSI on the 5-minute, 15-minute, and 1-hour timeframes for every coin in the scan and only surfaces the ones where all three line up in the same extreme zone — a much stronger signal than a single timeframe flashing oversold or overbought on its own.
Why Three Timeframes Instead of One
A single 5-minute RSI reading oversold happens constantly — dozens of times a day across the market — and most of those are just noise. Requiring 15-minute and 1-hour RSI to be extreme at the same time filters out the vast majority of those false signals, because it means the stretch isn’t just a brief wick but a condition that’s held up across a wider window. The tradeoff is fewer signals overall; this scanner is built to prioritize signal quality over signal frequency.
How “Confluence” Is Defined
A coin only appears as a LONG candidate when RSI is at or below the oversold threshold on all three timeframes at once. It only appears as a SHORT candidate when RSI is at or above the overbought threshold on all three timeframes at once. Both thresholds are adjustable directly from the interface, so you can tighten or loosen how extreme the RSI needs to be before a coin qualifies.
The Anti-False-Entry Filter
This is the part that sets the tool apart from a basic RSI screener: appearing in the confluence list doesn’t automatically mean a coin is flagged as a strong setup. Every candidate is additionally checked against three independent confirmation criteria:
- Reversal check — RSI on the 5-minute chart must already be turning back in the signal’s direction, rather than still falling or still rising. This filters out “catching a falling knife” scenarios where price is oversold but still in free-fall.
- Volume check — the most recently closed 5-minute candle must show volume at least 1.5x above its recent average, confirming real participation behind the potential reversal.
- MACD check (30-minute) — the 30-minute MACD must already show a histogram crossover in the signal’s direction, or already be positioned on the right side and gaining strength, confirming that the larger trend is actually starting to agree.
Each coin gets a confirmation score out of 3. Only setups that pass all three checks are marked as fully confirmed; partial matches are labeled clearly so you know exactly what’s missing (reversal, volume, or MACD) before deciding whether to act on it.
Example Scan
Say the scanner flags SOLUSDT as a LONG candidate: RSI reads 26 on the 5-minute, 24 on the 15-minute, and 27 on the 1-hour — all three below a 30 threshold, so it clears confluence. On the confirmation pass: the 5-minute RSI has just ticked up from 22 to 26 (reversal ✓), the last closed candle’s volume is 1.8x the recent average (volume ✓), but the 30-minute MACD histogram is still negative and hasn’t crossed yet (MACD ✗). The dashboard would show this as 2/3 confirmed, with MACD named as the missing factor — enough to put the coin on your radar, but not yet a fully validated setup by this tool’s own criteria.
What You See on the Dashboard
- A live-updating table of every coin currently showing RSI confluence, ranked and color-coded by direction (long/short)
- RSI values for all three timeframes shown as individual pills, plus the averaged RSI
- A confirmation badge on every row (3/3 confirmed, 2/3 with the missing factor named, or unconfirmed)
- 24h price change and volume for quick context
- A detail drawer for each coin showing the full RSI-by-timeframe breakdown, the exact validation results, and the raw MACD values behind the 30-minute confirmation
Filtering and Sorting Controls
You can filter results to show only longs, only shorts, or both; toggle a “confirmed only” mode to hide anything that hasn’t passed all three validation checks; adjust the oversold/overbought RSI thresholds; and sort the table by average RSI extremity, 5-minute RSI, 24h price change, or volume.
Feature Summary
| Feature | Purpose |
|---|---|
| Full-Market Scan | Checks every liquid USDT pair automatically, not just one coin |
| 3-Timeframe RSI Confluence | Requires 5M, 15M and 1H to agree before flagging a coin |
| Anti-False-Entry Score (3-point) | Confirms reversal, volume, and MACD before marking a setup as valid |
| Adjustable Thresholds | Customize how extreme RSI must be to qualify |
| Detail Drawer | Full breakdown per coin, including raw indicator values |
| Auto-Refresh | Re-scans the market on a fixed interval, no manual reloading |
Who Should Use This
This tool is built for traders who prefer scanning for opportunities across the whole market rather than watching a handful of coins manually. It’s especially useful for mean-reversion or reversal-style strategies, where catching an RSI extreme early — but confirmed by volume and MACD — matters more than following a single asset all day.
How to Use It
- Download the file below and open it in your browser.
- It automatically pulls Binance Futures market data — no setup needed.
- Adjust the RSI thresholds and filters to match your strategy.
- Click any row to open the detail drawer and review the full confirmation breakdown before deciding on a trade.
No API key, no account, completely free.
👉 Free Download
[Download RSI Confluence + MACD Scanner — Free]
Disclaimer
This tool is provided for educational and informational purposes only and does not constitute financial advice. Confirmation scores and confluence signals are generated algorithmically and do not guarantee trade outcomes. Cryptocurrency trading carries significant risk — always apply your own risk management and do your own research.