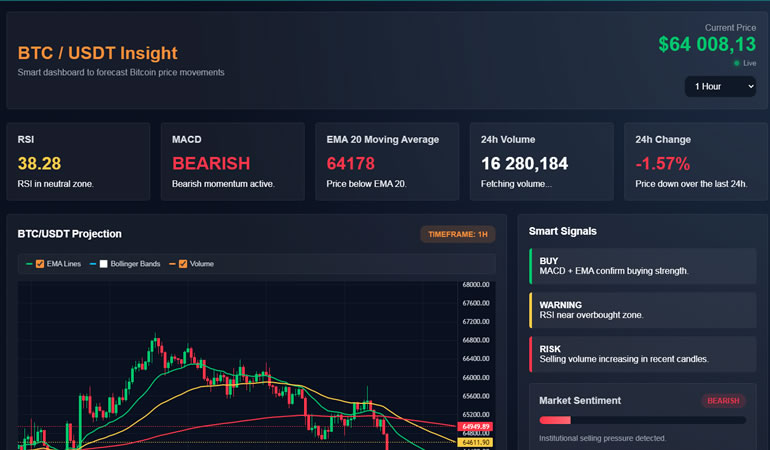

BTC/USDT AI Dashboard: A Free Indicator for the Coin That Moves Everything Else
Bitcoin sets the tone for the entire crypto market — when BTC turns, altcoins usually follow. That makes having a clean, reliable read on Bitcoin’s own momentum more valuable than almost any other single indicator. The BTC/USDT AI Dashboard was built exactly for that: a free, real-time tool that distills multiple layers of Bitcoin analysis into one score you can check in seconds.
Here’s a full breakdown of how it works.
Real-Time Data, Straight From Binance
The dashboard connects to Binance’s live WebSocket feed for tick-by-tick BTC/USDT price updates, and separately refreshes a full technical scan every 30 seconds — pulling candlestick history, 24-hour statistics, funding rate, and open interest directly from Binance’s public API. There’s no delay layer and nothing to configure; it starts working the moment you open it.
Why Bitcoin Reads Differently From Every Other Asset on This Site
Unlike altcoins, BTC isn’t just “another pair” — it’s the benchmark the rest of the market is measured against. Two things make BTC/USDT behave differently from the ETH, SOL, or BNB dashboards in this same series:
- Lower relative volatility. Bitcoin’s average daily ATR tends to run noticeably tighter than mid-cap altcoins — where SOL or PUMP might swing 5–8% in a session, BTC more typically moves in a 2–3% band outside of major news events. This dashboard’s ATR-based target sizing reflects that: BTC alerts generally carry tighter take-profit and stop-loss ranges than the altcoin versions of this tool.
- Dominance effect. Because so much altcoin liquidity is priced relative to BTC, a strong directional move in Bitcoin often drains or adds liquidity to altcoins rather than the other way around. That’s part of why this dashboard is useful even if you don’t trade BTC directly — it works as a leading signal for the rest of your portfolio.
Bitcoin’s Halving Cycle and Longer-Term Positioning
Bitcoin is the only asset in this dashboard series with a fixed, pre-programmed supply schedule. Roughly every four years, the rate of new BTC issuance is cut in half — a mechanic with no equivalent in ETH, BNB, SOL, or the other pairs covered elsewhere on this site. While the AI Score here is built for short-to-medium-term reads (5-minute to 1-hour timeframes), it’s worth remembering that BTC’s medium-term trend context is shaped by where the market sits in that multi-year cycle. A neutral AI Score during a historically supply-constrained phase carries different weight than the same reading during a post-halving distribution phase.
How the AI Score Is Built
Rather than making you check RSI, MACD, and moving averages separately, the dashboard combines them into one composite reading, the AI Score, on a 0–100 scale:
- RSI contributes bullish weight when it sits above the midline
- MACD contributes bullish weight when it’s in positive territory
- EMA 20 and EMA 50 contribute bullish weight when price is trading above both
- Funding Rate contributes bullish weight when positive, signaling the futures market is leaning long
The gauge turns green once the score passes 70%, red once it falls to 30% or below, and stays yellow in between — an at-a-glance way to gauge whether momentum currently favors buyers or sellers.
BTC/USDT Funding Rate: What’s Normal, What’s Extreme
Because Bitcoin futures carry the deepest liquidity of any pair on Binance, BTC/USDT funding rates tend to be more stable and less prone to the sharp spikes you’ll see on lower-liquidity pairs. A funding rate that would be considered mild on BTC might represent an already-crowded, over-leveraged position on a thinner pair like PUMP or LTC. This dashboard accounts for that by treating BTC funding extremes as a stronger signal of genuine market-wide over-leverage — since it takes a lot more capital to push BTC funding into extreme territory than it does for smaller-cap pairs.
Checking Three Timeframes Before Committing to a Trend
Bitcoin can show conflicting signals depending on which timeframe you’re looking at, so the dashboard checks trend direction independently across the 5-minute, 15-minute, and 1-hour charts, weighting the 1-hour reading more heavily in the final call. A trend is only treated as confirmed once enough of these timeframes actually align — reducing the chance of reacting to a short-lived wick.
Alerts With Volatility-Adjusted Targets
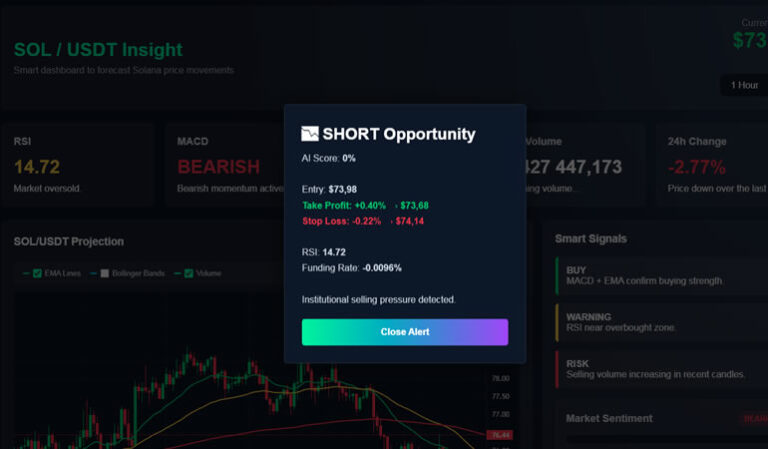
When the AI Score crosses above 80% or drops below 30%, the dashboard automatically surfaces a trade alert with a suggested entry, take-profit, and stop-loss. These targets aren’t static — they’re recalculated using Bitcoin’s current ATR volatility, the strength of the AI Score, and RSI momentum, so they naturally expand during high-volatility sessions (like macro news events) and contract when BTC is trading in a tight range.
Example Reading
Suppose RSI sits at 55, price trades just above EMA20 but below EMA50, and funding is close to flat. On a higher-beta altcoin, that mixed setup might already tip into bullish territory. On BTC, the AI Score engine treats this as a genuinely neutral read — Bitcoin’s lower volatility profile means the model requires firmer alignment across EMA20, EMA50, and funding before assigning a strong directional bias.
Full Panel Overview
| Panel | What It Tracks |
|---|---|
| Live Chart | BTC/USDT candles with EMA 20/50/200 and Bollinger Bands overlays |
| AI Score Gauge | Single composite score summarizing bullish/bearish bias |
| Multi-Timeframe Trend | 5m, 15m, and 1H direction displayed together |
| ATR Volatility Card | Reads current volatility as low, moderate, or high |
| Funding Rate & Open Interest | Live futures positioning data for extra context |
| Trade Alerts | Pop-up notification with dynamic TP/SL when a threshold is crossed |
Who Benefits Most From This Tool
Because Bitcoin’s price action tends to influence the broader market, this dashboard is useful even for traders who mostly trade altcoins — as a quick check on whether BTC itself is supporting or working against their setup. It’s equally practical for anyone trading BTC/USDT directly, spot or futures.
Getting Set Up
- Download the file using the link below.
- Open it in any modern browser — Chrome, Firefox, or Edge.
- It connects automatically to Binance’s data feed.
- Use the timeframe switcher and chart overlays to customize the view.
No API key, no account, no cost involved.
👉 Free Download
[Download BTC/USDT AI Dashboard — Free]
Disclaimer
This tool is provided for educational and informational purposes only and does not constitute financial advice. Bitcoin and other cryptocurrencies are highly volatile assets, and algorithmic signals do not guarantee future performance. Always manage your risk and do your own research before trading.