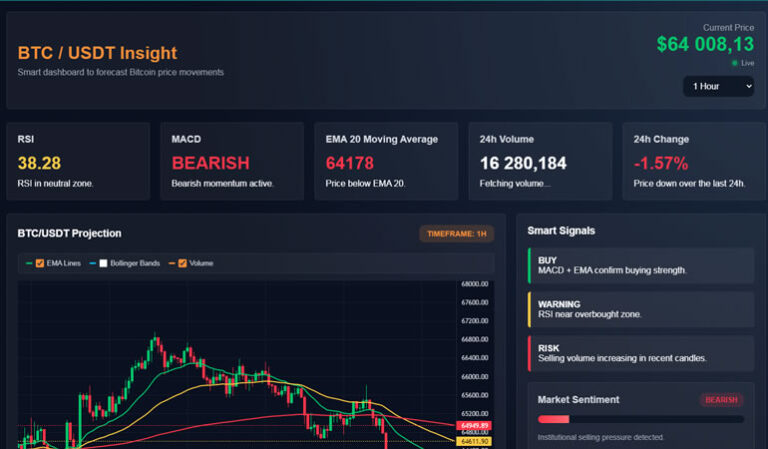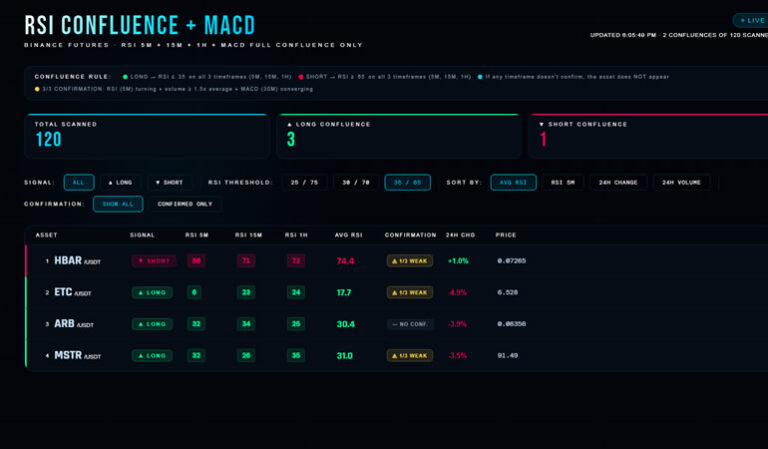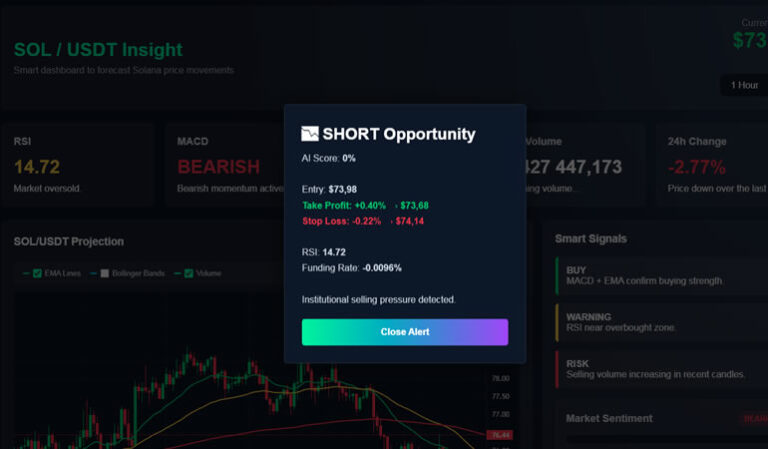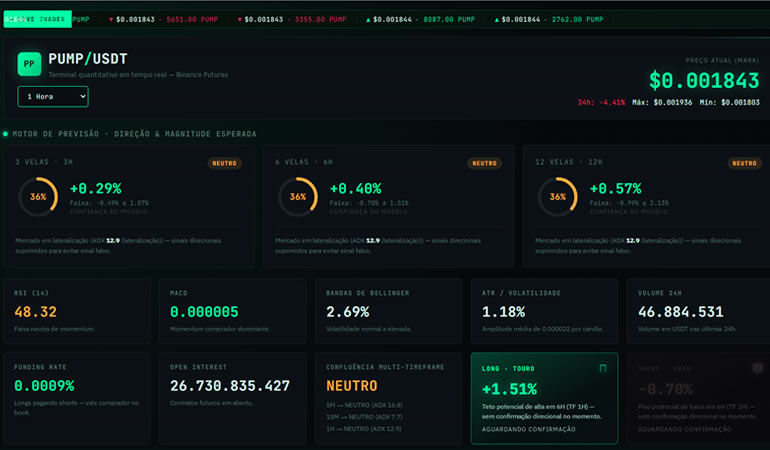

Most free crypto indicators just tell you what already happened. The PUMP/USDT AI Terminal goes a step further — it’s a quantitative-style dashboard, styled like a professional trading desk, that actually projects short-term price scenarios with a confidence score attached, while filtering out weak or choppy conditions so it doesn’t throw signals at you in dead markets.
Here’s a full walkthrough of what it does and how the forecasting logic actually works.
A Different Kind of Free Indicator
Visually, this one stands apart — a dark, terminal-style interface with a live scrolling trade tape, monospaced data readouts, and a layout built to feel like a professional quant desk rather than a simple widget. Functionally, it pulls live futures data for PUMP/USDT directly from Binance, streaming trades tick-by-tick over WebSocket and refreshing its full analysis on a short cycle using klines, 24h ticker data, funding rate (premium index), and open interest.
Why PUMP Needs a Noise Filter More Than Most Pairs
PUMP is one of the newer, smaller-cap assets covered in this series, and that changes the character of its price action in ways that matter for how you should read any indicator on it:
- Thinner order books. Compared to BTC or ETH, PUMP/USDT carries less depth, so the same-sized order moves price further. That means short-term RSI and MACD readings can spike on relatively modest volume — exactly the kind of noise this terminal’s ADX and confluence filters are designed to catch and suppress before they’re presented as a real signal.
- Wider funding rate swings. Because open interest is smaller, funding rate on PUMP can swing to extremes more easily than on BTC or ETH, where much larger positioning is needed to move the rate meaningfully. A funding reading that would be unremarkable on BTC can represent a genuinely crowded, over-leveraged book on PUMP.
- Sharper, faster moves. Newer, smaller-cap assets tend to see larger percentage swings in shorter windows. The terminal’s Bollinger Band squeeze detection and confidence-lowering during compression are especially relevant here, since a breakout on PUMP can arrive faster and larger than the equivalent setup on a major pair.
This is part of why the ADX regime filter and multi-factor confluence check matter more for a pair like this than they would on Bitcoin: without them, a low-liquidity asset like PUMP would generate far more false directional calls.
The Forecast Engine: More Than a Bullish/Bearish Label
Instead of a single score, the terminal generates three separate price projections based on the active timeframe — short, medium, and longer horizons (measured in candle multiples, so the actual time window adapts automatically whether you’re on the 5-minute or the 1-hour chart). Each projection includes:
- An expected percentage move, with a low/high range
- A confidence score (0–100%) shown on a circular gauge
- A plain-language reason citing the specific indicators behind the call
The underlying model blends RSI deviation from neutral, MACD histogram acceleration (not just direction — it checks whether momentum is actually speeding up), EMA spread between fast and slow averages, 5- and 15-period momentum, volume trend confirmation, Bollinger Band position, and bullish/bearish divergence detection into one composite score.
Built-In Noise Filters
What makes this tool different from a basic scoring system is that it actively suppresses signals in weak markets rather than forcing a direction:
- An ADX regime filter requires trend strength above a threshold before any directional call is allowed — below that, the market is treated as sideways chop and the forecast defaults to neutral.
- A confluence check requires a majority of the underlying factors (RSI, MACD, EMA spread, and both momentum readings) to actually agree before committing to a direction.
- A volume confirmation check reduces confidence when the recent move isn’t backed by above-average volume.
- During a Bollinger Band squeeze (tight compression), the tool widens its range and lowers confidence, since breakout direction is inherently harder to call.
Example Forecast
Suppose the medium-horizon panel shows an expected move of +3.2% to +5.8% with a 61% confidence score. The written reason cites RSI moderately above neutral, MACD histogram accelerating higher, and volume running above its recent average — three of five factors aligned. Because ADX is reading just above the trend-strength threshold rather than strongly elevated, the model caps confidence in the low 60s instead of pushing it higher, and the range stays comparatively wide to account for PUMP’s typically larger candle-to-candle swings versus a major pair like BTC.
Long vs. Short Scenario Cards
Alongside the forecast panel, the dashboard shows a side-by-side long scenario vs. short scenario view for the mid-range horizon, each with its own expected move, confidence level, and a written explanation of exactly how many factors are aligned and what the ADX regime looks like. Whichever side has the larger expected magnitude is visually highlighted, while the other is dimmed — so you can see at a glance which case the model currently favors.
Live Trade Tape and Standard Indicators
Beyond the forecast layer, the terminal also includes the fundamentals: a live scrolling tape of recent executed trades (color-coded buy/sell pressure), RSI, MACD histogram, Bollinger Band width, ATR-based volatility, 24h volume, funding rate, and open interest — all updating automatically.
Feature Summary
| Component | What It Adds |
|---|---|
| 3-Horizon Forecast Panel | Expected move %, range, and confidence gauge per horizon |
| ADX Regime Filter | Blocks directional calls in weak/choppy conditions |
| Confluence Scoring | Requires multiple indicators to agree before flagging a trend |
| Long/Short Scenario Cards | Side-by-side comparison of bullish vs. bearish case |
| Divergence Detection | Flags bullish/bearish RSI-price divergence automatically |
| Live Trade Tape | Real-time buy/sell prints streamed via WebSocket |
Who This Is For
This tool suits traders who want more than a simple buy/sell light — particularly those interested in short-term directional bias with a built-in sense of how reliable that bias currently is. Because it actively holds back on calling a direction in low-ADX or low-volume conditions, it tends to stay quiet during choppy stretches rather than firing false signals — a trait that matters more on a smaller-cap, lower-liquidity pair like PUMP than it would on Bitcoin.
Installation
- Download the file from the link below.
- Open it in any modern browser — no installation needed.
- It connects to Binance Futures data automatically.
- Switch timeframes from the dropdown; forecasts and horizons adjust automatically to match.
No account, no API key, no cost.
👉 Free Download
[Download PUMP/USDT AI Terminal — Free]
Disclaimer
This tool is provided for educational and informational purposes only and does not constitute financial advice. Price projections and confidence scores are generated by an algorithmic model and are not guarantees of future performance. Cryptocurrency markets are highly volatile — always manage your risk and do your own research before trading.