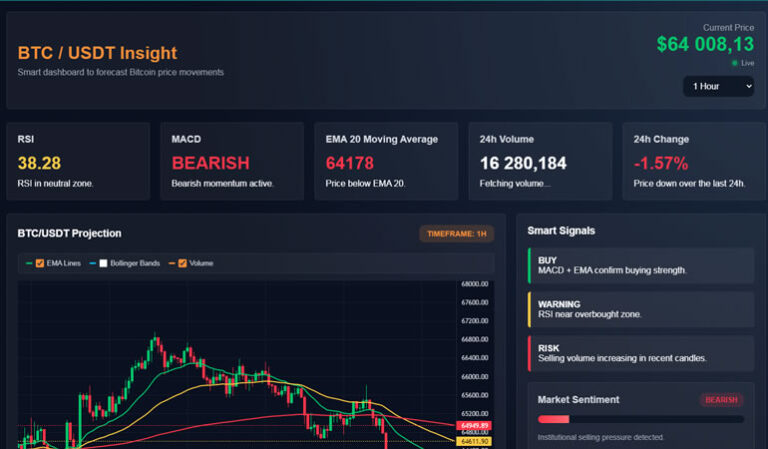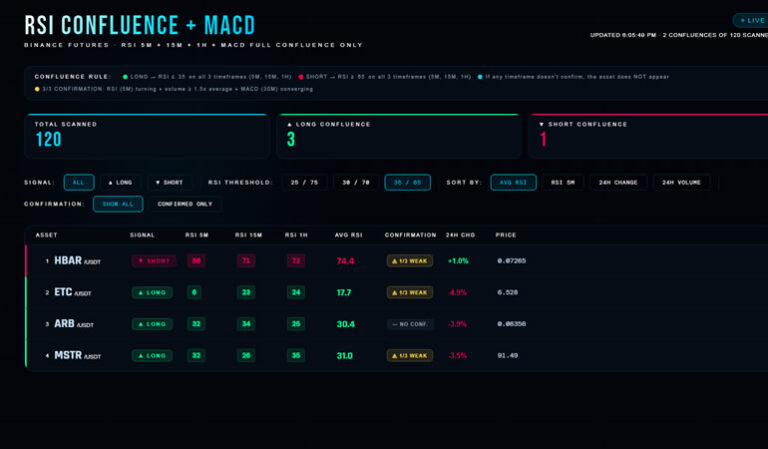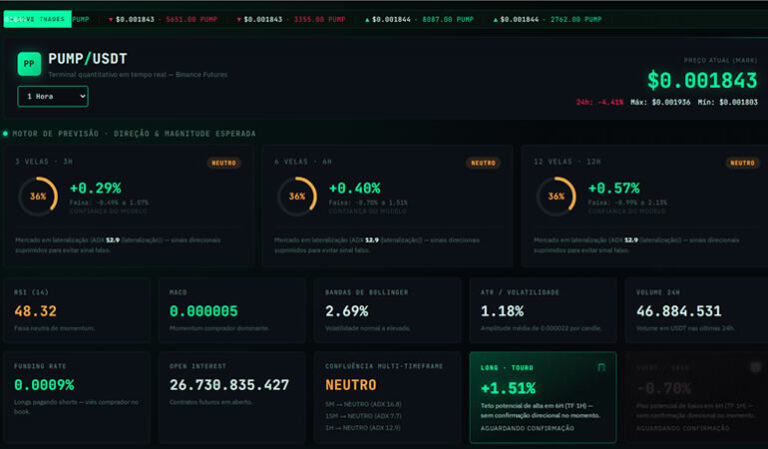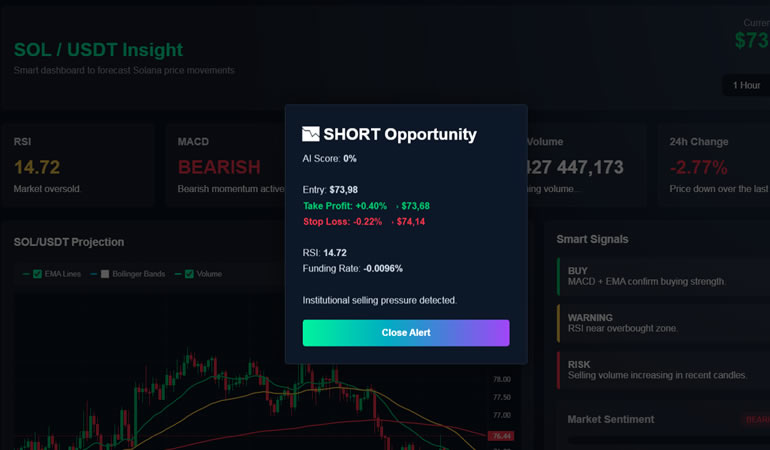

Solana is known for sharp, fast price swings — which makes manual chart-reading risky if you’re not watching closely. The SOL/USDT AI Indicator was built to handle that pace for you: a free, real-time dashboard that constantly reads price action, momentum, and volatility on SOL/USDT and boils it down into one clear signal.
Here’s what’s inside it.
Purpose-Built for SOL/USDT
This isn’t a repurposed multi-coin scanner — every part of the dashboard is configured for SOL/USDT specifically, streaming live trade data from Binance via WebSocket and refreshing its full technical read every 30 seconds using candle, ticker, funding rate, and open interest data pulled straight from Binance’s API.
Why Solana Trades Differently From BTC and ETH
Solana’s price action has a distinct character that shapes how this dashboard’s signals should be read:
- Network activity spillover. Bursts of on-chain activity — memecoin launches, NFT mints, or a spike in dApp usage on Solana — can move SOL independently of the broader market, in a way that has no real equivalent for BTC. A sudden RSI spike on this dashboard is worth checking against what’s happening on-chain, not just against price alone.
- Higher beta than the majors. Where BTC might move 2–3% on an average day, SOL routinely sees larger single-session swings, and can extend further and faster once a trend gets going. That’s part of why the ATR-based target sizing on this dashboard tends to produce noticeably wider ranges here than on the BTC or ETH versions of this tool.
- Faster candle turnover in practice. Because moves develop quickly on SOL, the 5-minute and 15-minute timeframe checks in the multi-timeframe trend confirmation carry more practical weight here — a lot can change on SOL between one 1-hour close and the next.
The Logic Behind the AI Score
Given how quickly Solana can move, the dashboard leans on a scoring system designed to catch shifts in momentum early. It checks:
- RSI — rewards readings above the midline as bullish
- MACD — rewards a positive reading as bullish momentum
- EMA 20 / EMA 50 — rewards price trading above both moving averages
- Funding Rate — rewards positive funding as a sign the market is leaning long
These four checks combine into a single AI Score between 0 and 100, shown on a gauge that turns green above 70%, red at or below 30%, and yellow in the undecided middle zone — giving you a fast visual read without digging through separate panels.
Confirming Trend Across Timeframes
Because Solana can fake out on lower timeframes, the dashboard runs its trend check independently on the 5-minute, 15-minute, and 1-hour charts, weighting the 1-hour result the heaviest. A trend only counts as confirmed when enough of these timeframes agree — reducing the odds of chasing a move that reverses a few minutes later.
Alerts That Adjust to Volatility
Once the AI Score breaks past 80% or drops under 30%, an alert pops up with a suggested entry along with take-profit and stop-loss levels. These aren’t fixed — they’re recalculated using SOL’s current ATR volatility, the strength of the score, and RSI, so targets naturally widen during a volatile breakout and tighten during quieter ranges. Given how fast SOL can move, this adaptive approach matters more here than on slower-moving pairs.
Example Reading
Suppose RSI sits at 64, price trades above both EMA20 and EMA50, MACD is positive, and funding is mildly positive — four of four factors leaning bullish. On a lower-beta pair like BTC, that combination might land the AI Score around the low-to-mid 70s. On SOL, the same alignment tends to push the score further into the 80s, since the model’s response to fully-aligned bullish factors scales with the asset’s typical volatility — which is also why a SOL alert crossing the 80% threshold triggers proportionally wider take-profit and stop-loss levels than the same threshold would on BTC or ETH.
Everything Visible on One Screen
| Section | Purpose |
|---|---|
| Live Candlestick Chart | EMA 20/50/200 and Bollinger Bands, fully toggleable |
| AI Score Gauge | One number summarizing bullish vs. bearish pressure |
| Multi-Timeframe Trend | 5m / 15m / 1H direction shown together |
| ATR Volatility Card | Labels current conditions as low, moderate, or high risk |
| Sentiment Bar | Visual strength of current buying or selling pressure |
| Open Interest | Live futures OI for extra market context |
Best Fit For
Traders actively following SOL/USDT — whether scalping intraday moves or holding swing positions — will get the most value from this dashboard. It’s designed as a fast-read confirmation layer, not a replacement for your own risk management or trade plan.
Setup Instructions
- Download the file using the link below.
- Open it directly in your browser — no install needed.
- It connects automatically to Binance’s public data feed.
- Adjust timeframes and chart overlays as you like.
No API key, no registration, no cost.
👉 Free Download
[Download SOL/USDT AI Indicator — Free]
Disclaimer
This tool is provided for educational and informational purposes only and does not constitute financial advice. Solana and other cryptocurrencies are highly volatile assets, and automated signals can be inaccurate. Always manage risk and do your own research before trading.