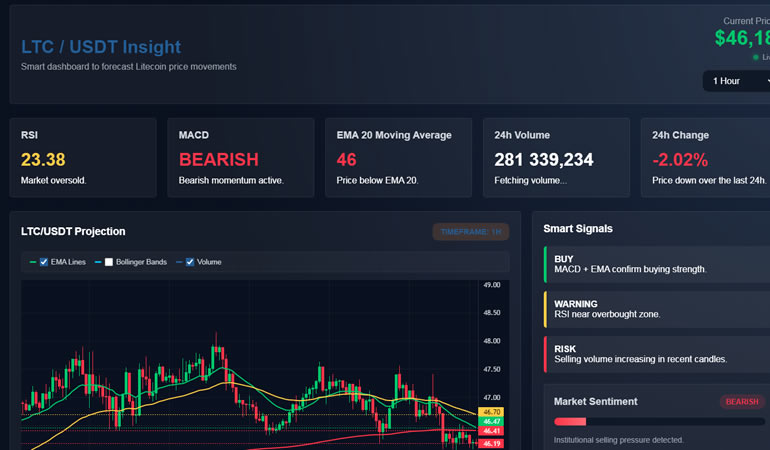

LTC/USDT AI Indicator: Free Real-Time Signals for Litecoin Traders
Litecoin doesn’t always get the same amount of analysis tools as Bitcoin or Ethereum, which makes it easy to trade blind. The LTC/USDT AI Indicator fixes that gap: it’s a free, browser-based dashboard that watches LTC/USDT around the clock, scores market conditions with an AI-style model, and alerts you the moment conditions line up for a potential trade.
Let’s walk through exactly what it does.
A Dedicated Litecoin Monitoring Tool
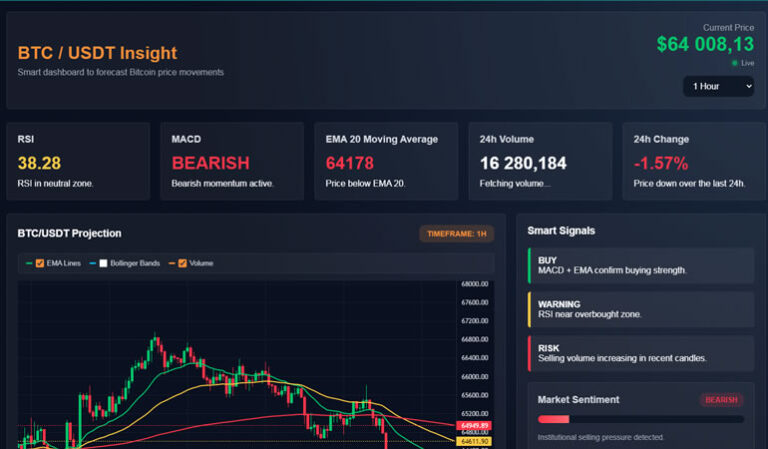
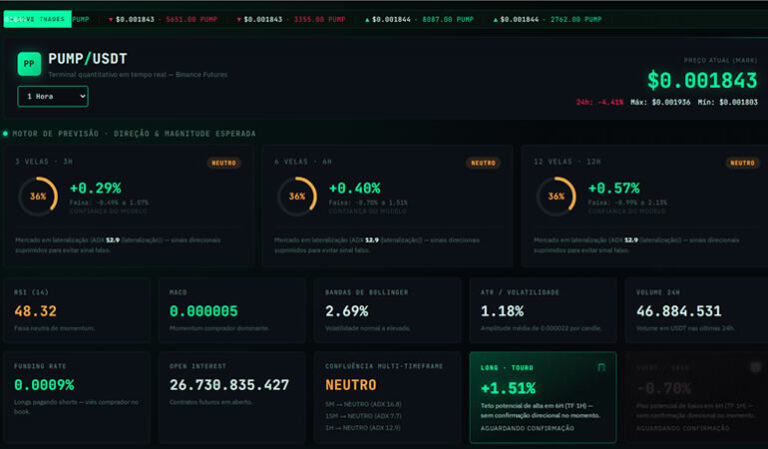
Rather than being a generic multi-asset scanner, this dashboard is wired specifically to the LTC/USDT pair on Binance. It opens a live WebSocket connection for tick-by-tick price updates and refreshes its full technical analysis every 30 seconds, pulling candlestick data, 24-hour stats, funding rate, and open interest directly from Binance’s public endpoints — no delays, no paid data feed required.
Why Litecoin Doesn’t Trade Like BTC, Even Though It’s Related
Litecoin is one of the oldest coins in this series, and its market behavior reflects that history in ways worth understanding before reading the AI Score:
- The “digital silver” lag effect. LTC has long tended to track Bitcoin’s broader direction but with a delay — often extending a move after BTC has already started one, rather than leading it. That means a strong AI Score on this dashboard is sometimes worth checking against what BTC already did in the prior session, since LTC can be playing catch-up rather than setting its own independent trend.
- Thinner derivatives market. LTC futures on Binance carry meaningfully less open interest than BTC or ETH, so funding rate here tends to move in a narrower, more muted band — it takes less capital to shift it, but extreme readings are also rarer since large leveraged positioning is less concentrated in LTC specifically compared to the majors.
- Its own halving schedule. Like Bitcoin, Litecoin has a fixed supply schedule with periodic halving events that reduce new issuance — a structural factor with no equivalent on ETH, SOL, or BNB. It doesn’t feed directly into this dashboard’s short-term AI Score, but it’s part of the longer-term backdrop worth keeping in mind when interpreting a sustained trend rather than a single reading.
Turning Five Indicators Into One Number
Manually checking RSI, MACD, EMAs, and funding rate every time you glance at the chart gets old fast. This tool automates that by feeding all four into a weighted scoring formula that outputs a single AI Score from 0 to 100:
- RSI above the midline adds bullish weight
- A positive MACD reading adds bullish weight
- Price trading above EMA 20 and EMA 50 adds bullish weight
- A positive funding rate (long-heavy market) adds bullish weight
The score is displayed as a circular gauge that shifts color — green once it clears 70%, red once it drops to 30% or below, yellow anywhere in between.
Cross-Timeframe Trend Filter
To avoid reacting to noise on a single chart, the dashboard independently checks trend direction on the 5-minute, 15-minute, and 1-hour timeframes, giving more weight to the higher timeframes in the final verdict. A trend is only confirmed as strong when the shorter and longer timeframes point the same way — helping cut down on false signals from short-lived spikes.
Volatility-Adjusted Trade Alerts
When the AI Score crosses 80% or falls below 30%, the dashboard triggers a pop-up trade alert with a suggested entry, take-profit, and stop-loss. Unlike static percentage targets, these are recalculated on the fly using current ATR (volatility), the signal’s confidence level, and RSI strength — so the suggested targets naturally stretch during volatile moves and shrink during calmer trading. Because LTC’s derivatives liquidity is thinner than BTC’s, sudden volatility spikes here can appear and fade faster, so this adaptive sizing matters more than it might on a deeper market.
Dashboard at a Glance
| Feature | What It Does |
|---|---|
| Live Chart | Candlesticks with EMA 20/50/200 and Bollinger Bands overlays |
| AI Score Gauge | Single 0–100 score summarizing overall market bias |
| Multi-Timeframe Panel | Shows 5m, 15m, and 1H trend side by side |
| Volatility Card | Flags current ATR as low, moderate, or high |
| Trade Alerts | Pop-up notification with dynamic TP/SL when a signal fires |
| Open Interest | Live futures OI for context on positioning |
Who Should Use It
Anyone actively trading LTC/USDT — spot or futures, scalping or swing trading — can use this as a quick sanity check before entering a position, or as a secondary confirmation layer next to their own setup. It’s also useful as a cross-check for BTC traders curious whether Litecoin is confirming or lagging Bitcoin’s current move. It’s not meant to replace a trading plan, but to speed up the process of reading multiple indicators at once.
How to Get It Running
- Grab the free download below.
- Open the file in any modern browser.
- It connects to Binance automatically — no API key or account needed.
- Switch timeframes and toggle overlays directly from the dashboard.
👉 Free Download
[Download LTC/USDT AI Indicator — Free]
Disclaimer
This indicator is provided for educational and informational purposes only and is not financial advice. Cryptocurrency markets carry significant risk, and no automated signal guarantees profit. Always apply your own risk management before trading.