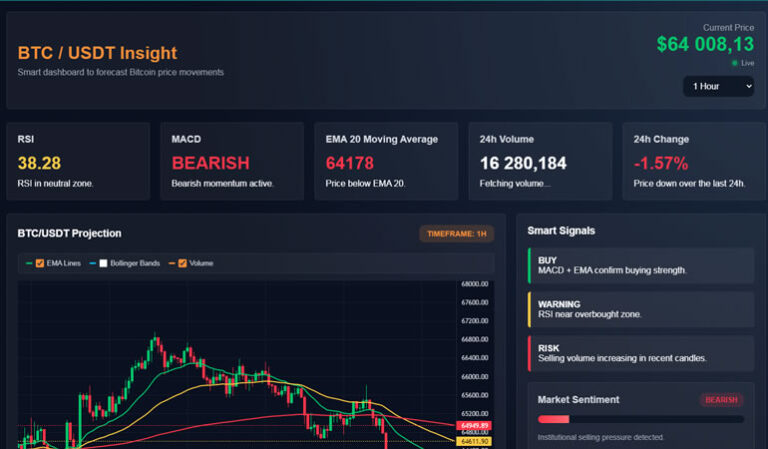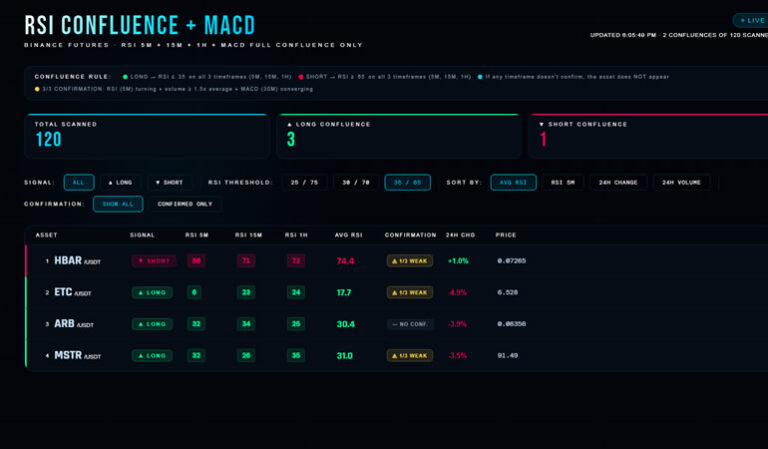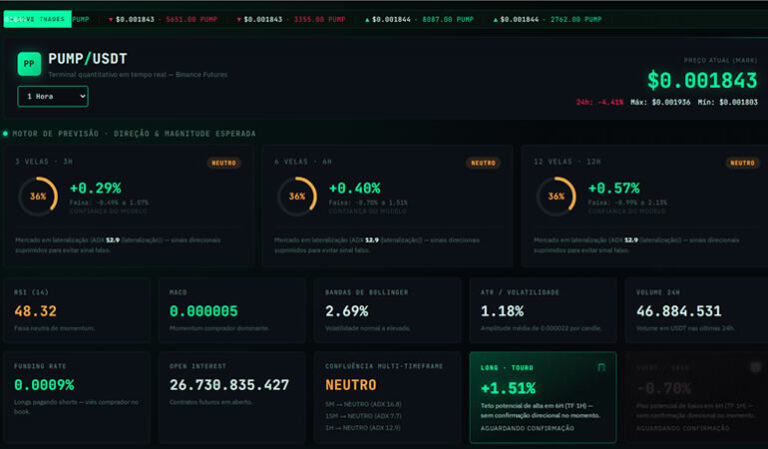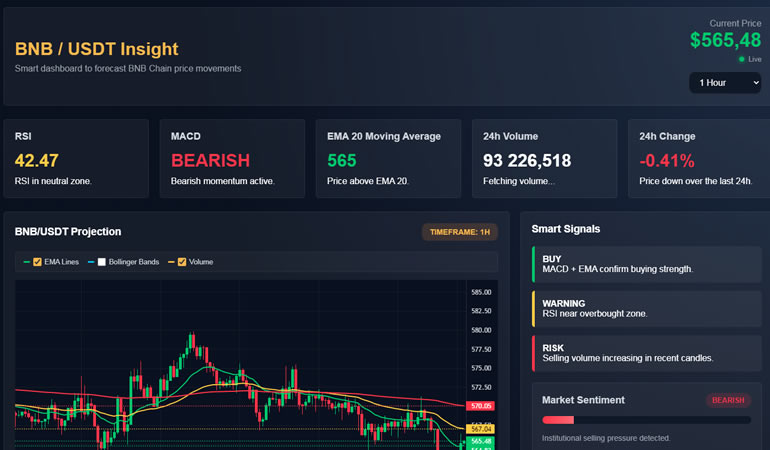

Trading BNB but tired of switching between five different charts to figure out what the market is actually doing? The BNB/USDT AI Trading Dashboard puts everything in one screen — live price, trend strength, volatility, and an automated AI-driven score that tells you when the odds favor buyers or sellers. And it’s completely free.
Here’s a full breakdown of what’s under the hood.
Built Specifically for BNB/USDT
Unlike generic multi-coin scanners, this dashboard is tuned exclusively for the BNB/USDT pair, pulling live data straight from Binance — no delays, no third-party data resellers. Price updates stream in real time through a WebSocket connection, while a full technical scan refreshes automatically every 30 seconds pulling candles, 24h stats, funding rate, and open interest straight from Binance’s API.
Why BNB Doesn’t Move Like a Typical Layer-1 Coin
BNB’s price drivers are structurally different from ETH, SOL, or the other assets in this series, and that shapes how the AI Score here should be interpreted:
- Quarterly token burns. Unlike coins with a constant or purely inflation-driven supply, BNB’s circulating supply is periodically reduced through scheduled burns tied to exchange activity. This doesn’t feed into the short-term technical model directly, but it means BNB can show longer-term supply-driven strength that a purely momentum-based score won’t fully capture on its own — worth keeping in mind around burn announcement periods specifically.
- Correlation with Binance platform activity. Because BNB is used for fee discounts, launchpool participation, and other utility within the Binance ecosystem, its price can react to exchange-specific news — new listings, launchpool events, platform announcements — in ways that are largely disconnected from what BTC or ETH are doing at the same moment. A strong AI Score with no clear macro catalyst is sometimes explained by exchange-specific activity rather than broader market momentum.
- Funding rate tied to a narrower trader base. BNB futures open interest is smaller and more concentrated than BTC’s, so funding rate swings here can reflect the positioning of a comparatively narrower set of traders — useful context when the funding component of the AI Score moves sharply.
How the Tool Thinks: The AI Scoring Model
At the heart of the dashboard is a point-based scoring model that turns five separate signals into one number between 0 and 100:
- Momentum from RSI (bullish points if above the midline)
- Trend direction from MACD
- Price position relative to EMA 20 and EMA 50
- Funding rate bias (positive funding suggests the market is crowded long)
The combined score is displayed on a color-coded gauge — green for bullish territory (70%+), red for bearish (30% or below), and yellow for a market that’s still deciding.
Three Timeframes, One Verdict
Instead of trusting a single chart, the dashboard runs the same trend logic across the 5-minute, 15-minute, and 1-hour timeframes and weights the longer ones more heavily. Only when the shorter and longer timeframes actually agree does it flag a strong trend — this is what helps filter out fakeouts on lower timeframes.
Instant Alerts, Not Fixed Targets
When the AI Score breaks above 80% or drops below 30%, a popup alert fires with a suggested trade setup — but instead of a generic “1% TP, 0.5% SL,” the take-profit and stop-loss are recalculated live based on current ATR volatility, the strength of the signal, and RSI momentum. That means targets widen automatically during volatile sessions and tighten up when BNB is trading in a quiet range.
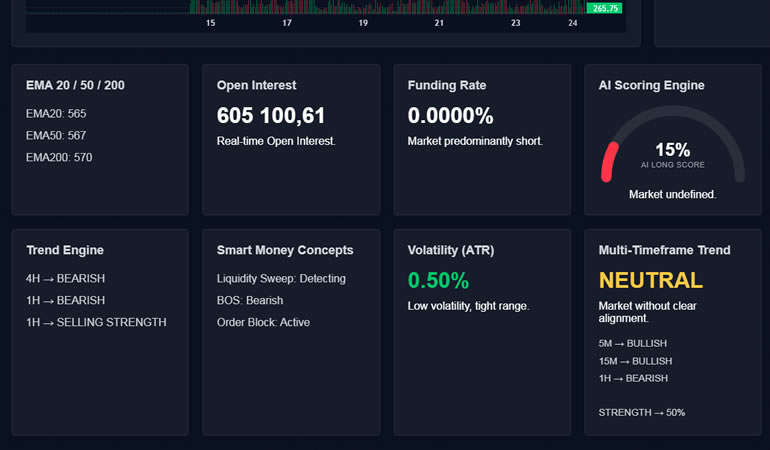
What Else the Dashboard Tracks
| Panel | What It Shows |
|---|---|
| Volatility (ATR) | Whether current price swings are low, moderate, or high |
| Open Interest | Real-time futures OI for BNB/USDT |
| Market Sentiment Bar | Visual buy/sell pressure based on the AI Score |
| Multi-Timeframe Panel | Trend direction for 5m, 15m and 1H side by side |
| Chart Overlays | EMA 20/50/200 and Bollinger Bands, toggle on/off |
Best Use Case
This dashboard fits traders who follow BNB specifically — whether for spot swing trades or futures scalping — and want a single-glance confirmation tool instead of manually cross-referencing indicators. Because BNB reacts to Binance-specific news as much as broader crypto sentiment, it also works well as a second opinion layered on top of your own research into what’s driving the exchange ecosystem at the moment — rather than as a stand-alone signal generator.
Getting Started
- Download the file below.
- Open it in your browser — Chrome, Firefox, or Edge all work fine.
- It connects to Binance automatically; nothing to configure.
- Toggle chart overlays and switch timeframes as needed.
No sign-up, no API key, no cost.
👉 Free Download
[Download BNB/USDT AI Trading Dashboard — Free]
Disclaimer
This tool is for educational and informational purposes only and does not constitute financial advice. Crypto markets are highly volatile, and automated signals can be wrong. Always manage your risk and do your own research before trading.