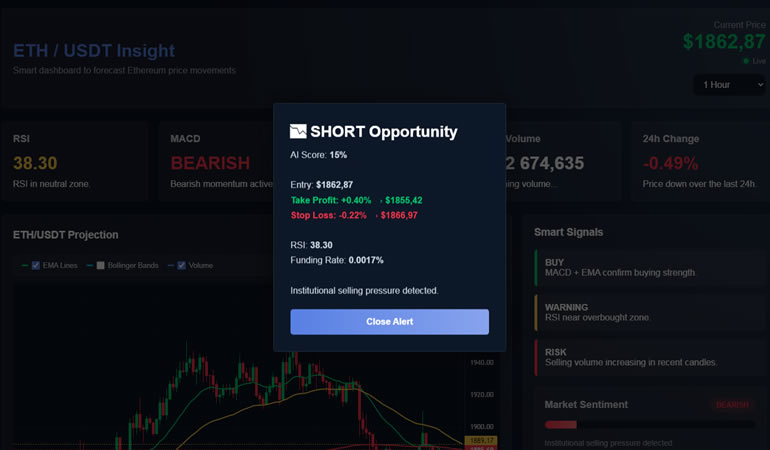

ETH/USDT AI Insight Dashboard: Free Real-Time Crypto Indicator
If you trade Ethereum and want a clear, data-driven view of the market without paying for expensive tools, the ETH/USDT AI Insight Dashboard is built for you. This free indicator connects directly to Binance in real time and combines several classic technical indicators into a single AI-weighted score, so you can see at a glance whether the market favors buyers or sellers.
Below, we break down exactly how it works, what data it uses, and how to install it — completely free.
What Is the ETH/USDT AI Insight Dashboard?
This is a standalone, browser-based trading dashboard built specifically for the ETH/USDT pair. It streams live price data via WebSocket directly from Binance and updates its full technical analysis every 30 seconds using Binance’s REST API (candles, 24h ticker, funding rate, and open interest).
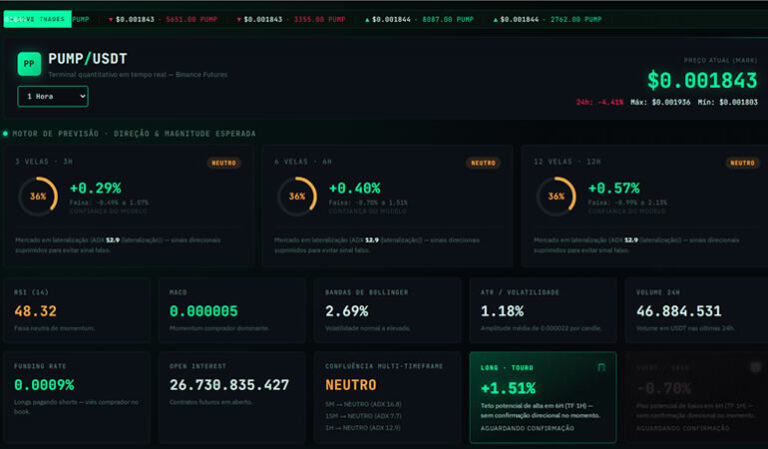
Instead of forcing you to interpret five or six indicators separately, the dashboard blends them into one AI Score (0–100%), displayed as a gauge, so you get an instant read on market bias — bullish, bearish, or neutral.
Why ETH/USDT Behaves Differently From BTC
Ethereum tends to amplify Bitcoin’s moves — when BTC rallies, ETH often rallies harder, and the same is true on the downside. This “beta effect” means the AI Score on this dashboard can swing faster than a BTC-only indicator. Two ETH-specific factors also feed into how the score should be read:
- Gas fees and network activity. Spikes in on-chain activity — NFT mints, DeFi liquidations, large token unlocks — can move ETH independently of BTC, in a way that has no direct equivalent on a pure store-of-value asset.
- Staking dynamics. A large share of ETH supply is locked in staking, which historically dampens some downside volatility compared to more liquid, unstaked assets. This is part of why ETH’s ATR-based target sizing on this dashboard tends to sit between BTC’s tighter ranges and the wider ranges seen on higher-beta assets like SOL.
Key Features
1. Real-Time Price and Live Chart
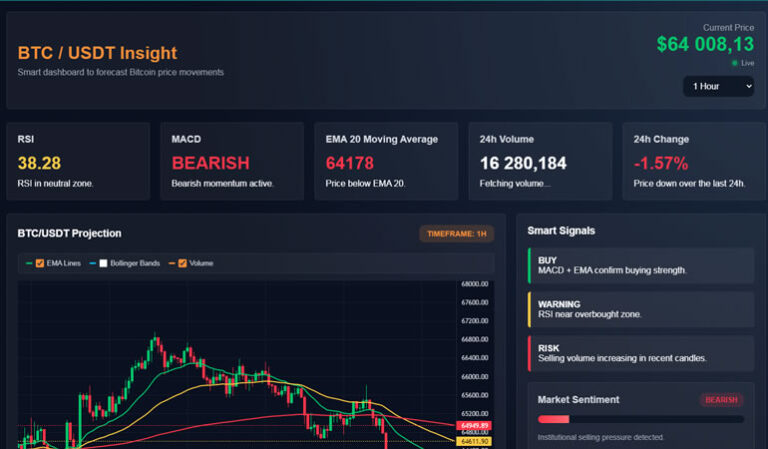
The dashboard uses TradingView’s Lightweight Charts library to render live ETH/USDT candlesticks, with toggleable overlays for EMA 20/50/200, Bollinger Bands, and volume. A connection indicator shows whether the live feed is active, connecting, or disconnected.
2. AI Score Engine
The core of the tool is a weighted scoring system that combines:
- RSI (momentum) — adds points when above 50
- MACD (trend momentum) — adds points when bullish
- Price vs. EMA 20 and EMA 50 — adds points when price trades above both
- Funding Rate — adds points when positive (long-biased market)
The result is a single percentage score. Scores above 70% point to a bullish bias, scores below 30% point to a bearish bias, and anything in between is treated as neutral chop.
3. Multi-Timeframe Trend Confirmation
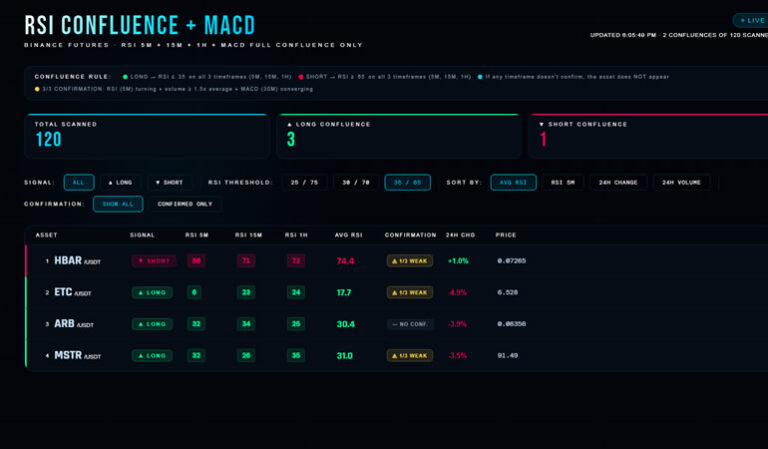
Rather than relying on a single timeframe, the dashboard cross-checks trend direction on the 5-minute, 15-minute, and 1-hour charts, weighting the higher timeframes more heavily. This helps filter out short-term noise and confirms whether smaller and larger timeframes are actually aligned before flagging a trade idea.
4. Automatic Trade Alerts with Dynamic Targets
When the AI Score crosses key thresholds (≥80% for a potential long, ≤30% for a potential short), the dashboard automatically pops up an alert with:
- Suggested entry price
- A dynamic take-profit and stop-loss, calculated from current volatility (ATR), the AI Score’s confidence, and RSI momentum
- Current RSI and funding rate for context
This means targets aren’t fixed percentages — they adjust based on how volatile ETH is at that moment.
5. Volatility, Open Interest, and Market Sentiment
Additional cards track ATR-based volatility (with a plain-language read: low, moderate, or high), Open Interest, and a sentiment bar that visually represents the current AI Score as bullish, bearish, or neutral pressure.
ETH/USDT Funding Rate Context
ETH perpetual futures on Binance carry some of the deepest liquidity on the platform, second only to BTC — deep enough that funding rate here moves in a more measured way than on smaller-cap pairs like LTC or PUMP, but still with more sensitivity to leveraged long/short positioning shifts than BTC itself. Because ETH attracts a large base of both spot and derivatives traders independently of Bitcoin, this dashboard weighs funding more heavily during high-volatility periods specifically for ETH, since crowded long positioning in a high-beta asset has historically preceded sharper corrections than the same setup on BTC.
How to Read the Dashboard
| Signal | What It Means |
|---|---|
| AI Score ≥ 70% | Institutional-style buying pressure, bullish bias |
| AI Score ≤ 30% | Dominant selling pressure, bearish bias |
| AI Score 30–70% | Sideways market, no clear dominance |
| RSI > 70 | Overbought |
| RSI < 30 | Oversold |
| Funding Rate positive | Market leaning long |
| Funding Rate negative | Market leaning short |
Example Reading
Suppose RSI sits at 58, price trades above both EMA20 and EMA50, and funding is mildly positive — a combination that might read as neutral-to-bullish on BTC. On ETH, because of its higher beta relative to Bitcoin, the AI Score engine assigns slightly more weight to the EMA alignment, so the same inputs typically push ETH’s score a few points higher into clearer bullish territory than the equivalent BTC reading would show.
Who Is This Indicator For?
This tool is ideal for day traders and swing traders who follow ETH/USDT and want a fast way to combine multiple indicators into one clean view, instead of jumping between RSI, MACD, EMA ribbons, and funding data on separate screens. It also works well as a secondary confirmation tool alongside your existing strategy — and as a cross-check for BTC traders curious whether ETH is confirming or amplifying Bitcoin’s current move.
How to Install It
- Download the file using the link below.
- Open it in any modern browser (Chrome, Edge, Firefox) — no installation required.
- The dashboard connects automatically to Binance’s public API and WebSocket feed.
- Use the timeframe selector and chart toggles to customize your view.
No account, no API key, and no payment required.
👉 Free Download
[Download ETH/USDT AI Insight Dashboard — Free]
Disclaimer
This tool is provided for educational and informational purposes only. It does not constitute financial advice. Cryptocurrency trading involves substantial risk, and past performance or algorithmic signals do not guarantee future results. Always do your own research and manage your risk before trading.